Seamless application performance is crucial for maintaining customer satisfaction and reaching business objectives. To illustrate the impact, consider this: a mere one-second delay in page response can trigger a 7% reduction in conversions. Assuming your business has a consistent conversion rate and makes £500 per day, such a delay could lead to a loss of nearly £13k over a year.
Among various tools available, DataDog stands out by offering a comprehensive solution for monitoring and enhancing application performance. This platform enables businesses to monitor their applications’ performance closely, providing real-time insights that allow for prompt issue resolution, ensuring a smooth and responsive user experience.
In this article, we will delve into how DataDog’s metrics can identify bottlenecks and optimize performance; additionally, we’ll discuss how to monitor latency in real time using its Application Performance Monitoring (APM) feature.
Let’s begin.
What is DataDog?
DataDog is a popular cloud-based monitoring and analytics platform that provides comprehensive insights into your applications, infrastructure, and user experiences. It allows you to collect, visualize, and analyze metrics, traces, and logs from various sources. One of its standout features is Application Performance Monitoring (APM), which offers real-time insights into your application’s behavior.
It excels at collecting metrics from various application stack components, including servers, databases, containers, and microservices. Using APM, you can see how much resources are consumed on each application layer. These metrics provide a detailed view of your application’s performance, helping you identify areas that need improvement.
How to Get Started with DataDog’s APM?
Starting with DataDog’s Application Performance Monitoring (APM) is a straightforward process. Here’s how you can get DataDog’s APM up and running to begin optimizing your application’s performance:
1. Create a DataDog Account: If you don’t have a DataDog account already, head over to the DataDog website and sign up. Choose a plan that suits your needs and complete the registration process.
2. Install the DataDog Agent: Download and install the DataDog Agent on your server or local machine. This agent will collect your application’s metrics, traces, and logs and send them to DataDog.
3. Configure APM: After installing the agent, you’ll need to enable APM. Open the DataDog Agent configuration file and set the apm_config.enabled option to true.
4. Instrument Your Application: Instrumentation is adding a tracing code to your application. DataDog provides libraries for programming languages like Java, Python, Ruby, and others. Follow the instrumentation documentation on DataDog’s website to instrument your application correctly.
5. Verify Your Setup: Once you’ve instrumented your application, verify that the DataDog Agent receives trace data. Go to the APM page in the DataDog app and look for your service in the services list.
6. Explore Your Data: Navigate through DataDog’s APM interface to explore the performance data collected from your application. You can view traces, analyze performance metrics, and identify bottlenecks easily with the intuitive UI.
7. Set Up Alerts: Create alert conditions to receive notifications when performance metrics fall outside of your defined thresholds. This will help you react quickly to potential issues.
After following all these steps, you’ll be able to create custom dashboards to visualize the metrics that are most relevant to you, thereby facilitating quicker insights and analysis.
Performance Tuning with DataDog Metrics
DataDog provides a variety of metrics for exploration, and understanding how to collect and analyze these metrics can enhance application performance. Here is an examination of three core aspects that can be tuned using DataDog metrics:
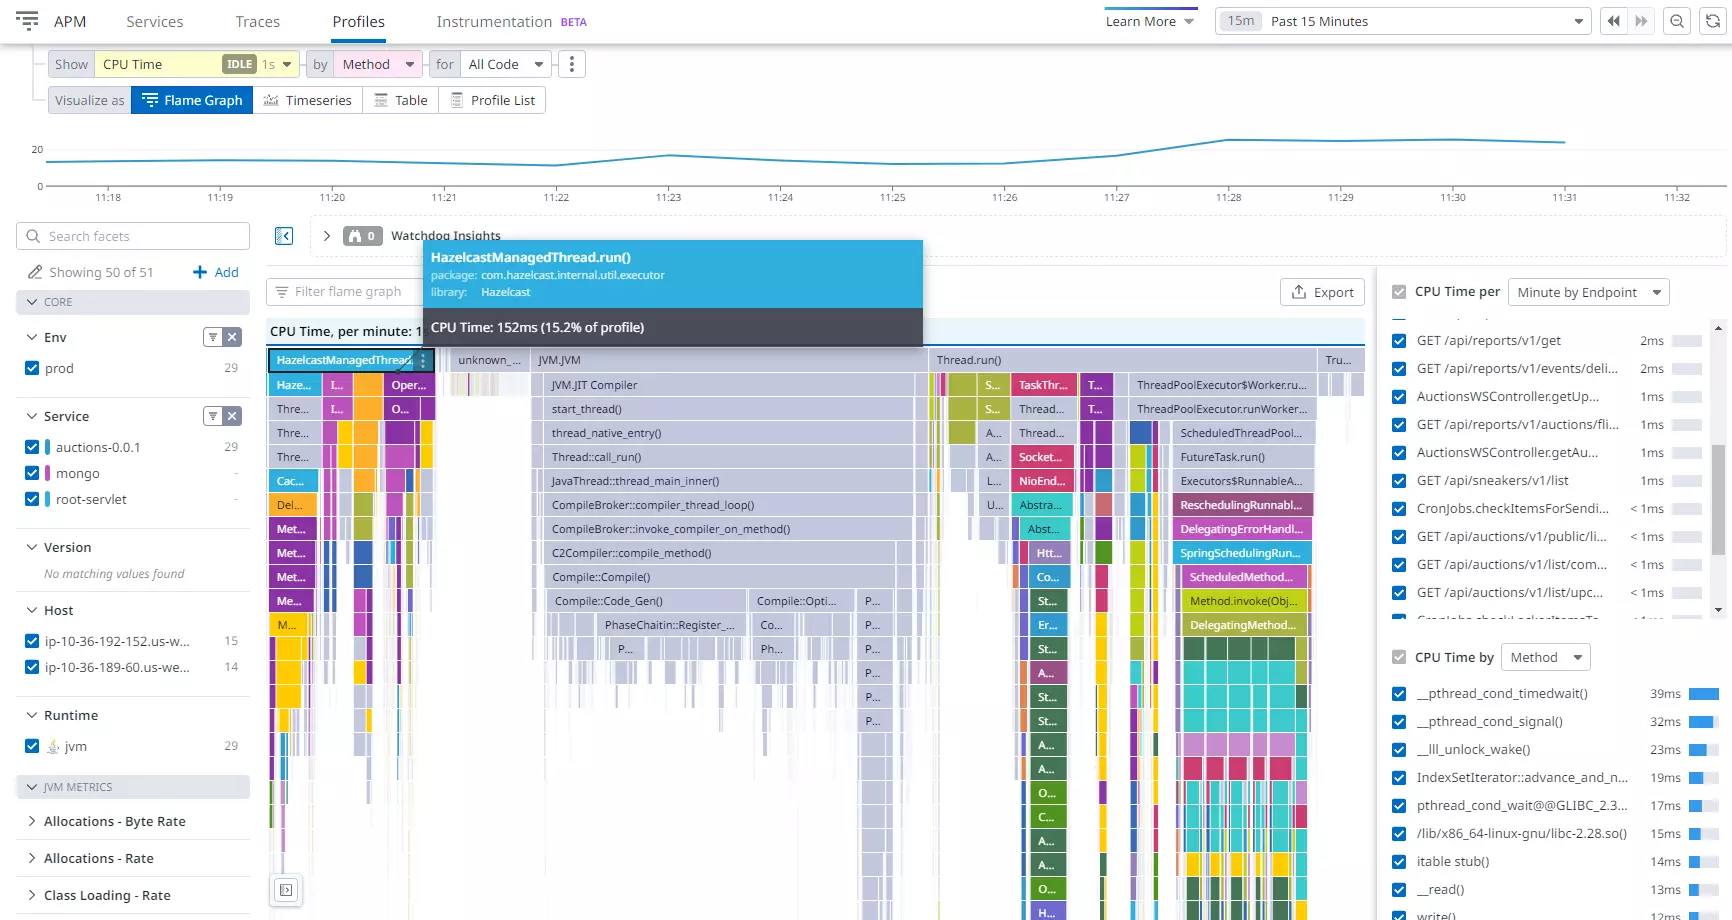
CPU-consuming methods and endpoints
In DataDog’s APM, go to Profiles > Flame Graph to find and visualize the top 10 CPU-consuming methods and endpoints. To create a graph, set the search criteria:
Show: CPU time
By: Method
For: All code

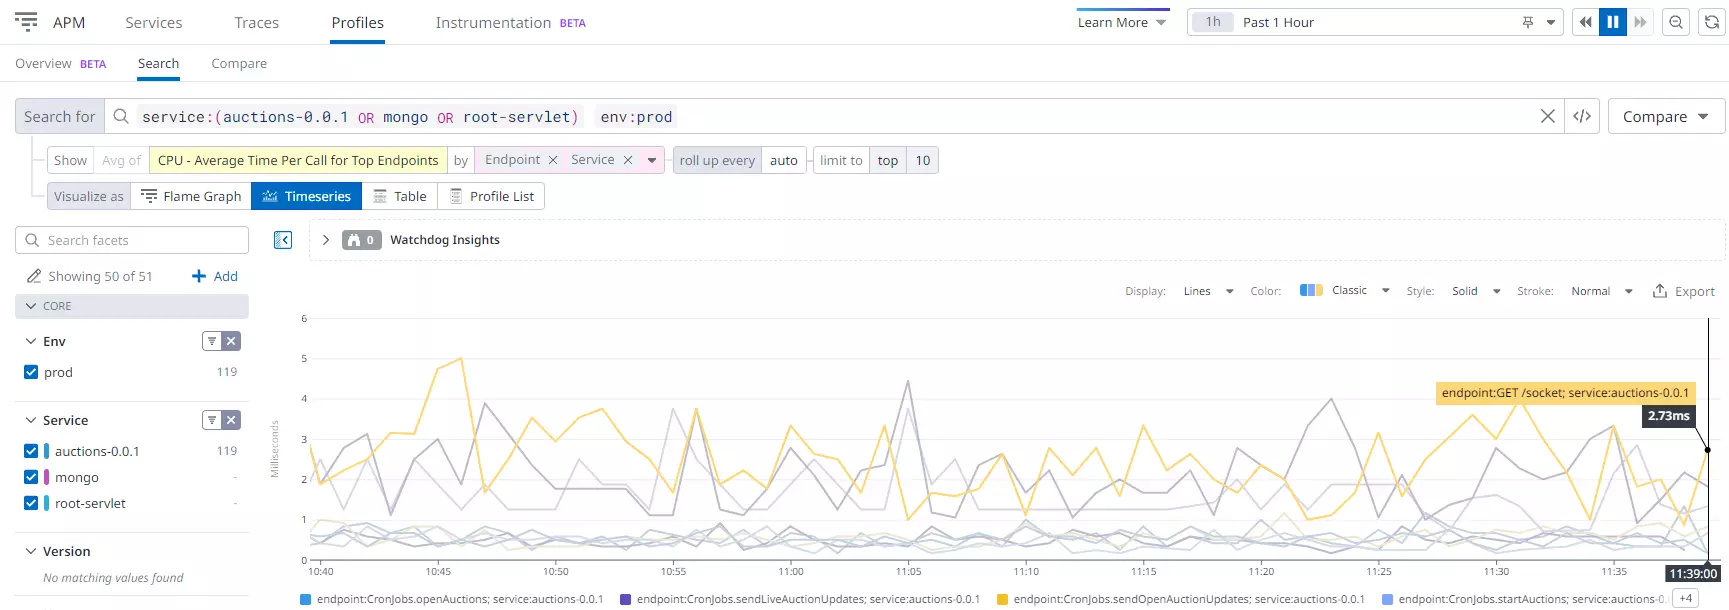
Performance bottlenecks
In DataDog’s APM, navigate to Profiles > Timeseries to analyze performance bottlenecks affecting your application’s efficiency. By examining metrics related to CPU usage, memory, and network traffic, you can identify these bottlenecks and prioritize areas for optimization.
Experiment with various filters to aid in bottleneck identification, such as:
- Average time per call for top endpoints
- Total time for top methods, endpoints, threads
Understanding and addressing performance bottlenecks is crucial for ensuring the smooth operation of your application.

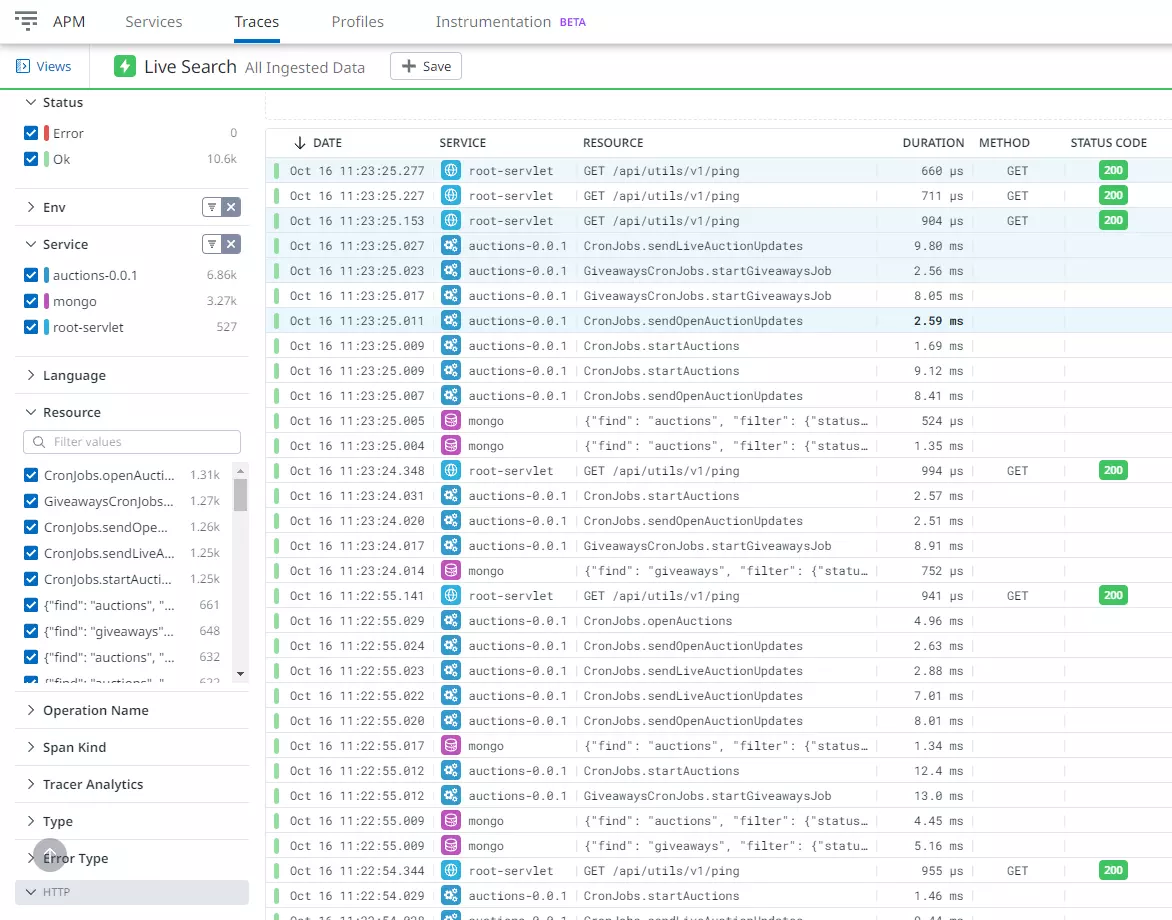
Real-time Latency Monitoring
In DataDog’s APM, go to the Traces section to access Real-time Latency Monitoring. This feature elevates performance monitoring by enabling real-time tracking and analyzing your application’s latency. Through APM, you can discern how various application components influence overall performance, aiding in swiftly identifying and resolving issues that might adversely affect user experience.

What Are the Benefits of Using DataDog’s APM?
Utilizing DataDog’s APM, you can address performance problems as they occur, ensuring a smooth user experience. Here are some significant benefits of using DataDog for Application Performance Monitoring:
Comprehensive Insights
DataDog’s APM provides a 360-degree view of your application, helping you identify issues and opportunities for optimization. This comprehensive insight is invaluable for maintaining and enhancing the performance of your application.
Time and Cost Savings
You save your team valuable time and resources by pinpointing bottlenecks and inefficiencies. The earlier you can identify and address issues, the lesser the impact on your budget and project timelines.
Real-Time Monitoring
Real-time monitoring of your application’s performance allows immediate response to any issues. This feature ensures a seamless user experience and addresses problems before they escalate.
Historical Data Analysis
Access to and analysis of historical data helps identify trends, which can be invaluable for long-term performance optimization. By understanding past performance, you can make informed decisions for future improvements.
Customizable Dashboards
Creating custom dashboards to monitor the metrics most relevant to your team improves operational efficiency. It allows for a tailored monitoring experience that caters to the specific needs of your project.
Integration Capabilities
Seamlessly integrating with other tools and platforms enhances your monitoring and analysis capabilities. This integration facilitates a more holistic approach to application performance monitoring.
Scalability
DataDog grows with you as your application grows, ensuring consistent monitoring regardless of your app’s size. This scalability is crucial for maintaining performance standards in evolving projects.
Alerting and Notification Features
Receiving alerts and notifications for predefined conditions ensures prompt attention to potential issues. Timely notifications allow quicker response times, minimizing the impact of any performance hiccups.
Collaboration Features
Collaborating with your team within the DataDog platform promotes effective communication and problem-solving. A centralized platform for discussion and analysis fosters a collaborative environment for addressing performance issues.
Security Monitoring
Utilizing DataDog’s security monitoring features helps keep a close eye on the security posture of your application, identifying and addressing security issues promptly. Ensuring security alongside performance is crucial for maintaining user trust and compliance standards.
Conclusion
A robust tool like DataDog is immensely beneficial in application development and management. You can significantly enhance your application’s performance and efficiency by collecting metrics, pinpointing bottlenecks, optimizing database queries, and real-time latency monitoring via APM.
The outcome transcends improved user experiences, extending to heightened efficiency and diminished operational costs. Hence, if elevating your application’s performance is your aim, exploring DataDog’s capabilities is worthwhile.


